Kevin Wood
Kevin Wood, oldWeather’s chief scientist for the last few years, died on Monday February 14th 2022, after a long illness. He was 59.
Wednesday, November 3rd, 2010, was a red-letter day for oldWeather: we were only a few weeks into the launch of the project, but we’d already got some results, and it was clear it was going to be a big success. Along with a couple of colleagues from Zooniverse, I’d come to a conference in Baltimore to present our results – our presentations were very well received, but that’s not why I remember the day so clearly.
Among the other people at that meeting one stood out: a friendly, enthusiastic, slightly scruffy, scientist from Seattle. He seemed, oddly, to be both older and younger than I was – clearly middle aged and experienced, but with the reputation and attitude of a much younger man. I soon learned that this was because science was his second career – he’d spent 25 years as a merchant marine officer before doing a PhD at the University of Washington and joining PMEL. He was instantly keen on oldWeather, and we were delighted to have him on board – we already had some good scientists, but I was very happy to add an actual mariner to the science team – someone with first-hand experience of ships and logbooks. If that had been all he offered, Kevin would have been a great asset, but we got much, much, more than that.
Kevin was a good scientist, an enthusiast for marine history, an experienced manager, and a genius at building support for research programs. I watched with awe as he charmed the National Archives in Washington D.C., raised the money for an imaging program, recruited people to work on it, and started producing the images that we know as oldWeather-Arctic. These rapidly became the main component of oldWeather, and over the years Kevin expanded this imaging program and started others. He became more and more important to oldWeather and eventually took over leadership of the whole project.
Kevin did much more than work on oldWeather. He did a lot of expedition work into the Bering and Chukchi seas: working on RUSALACA, a chief scientist for Arctic Heat, flying missions on NOAA research aircraft, and longer cruises on research ships. He was a producer for Arctic Report Card and did a lot of great outreach work – mentoring junior scientists (and archivists), and communicating science to the press and the public.
But most of all, Kevin was a great guy. He was never a colleague – he went straight to friend, and I delighted in his friendship for more than a decade. It’s more than 7,500km from my home in Exeter to Kevin’s in Seattle, so he visited me only once, and we communicated mostly by internet. But we met, as researchers do, in meetings and workshops all over the world, and I treasure memories of time spent with him in Beijing, and Hong Kong, … Particulaly, perhaps, in Maynooth – where I spent several happy evenings drinking Guinness with Kevin and his wife Kelly; and in Boulder – where he drove me through Rocky Mountains National Park in his MX5, and we would walk (and talk) along the trails behind Table Mesa.
And Kevin did much of this in spite of being seriously ill. He suffered from lung cancer – perhaps a result of all those months spent working in smokey environments on Russian icebreakers. Medical science kept this at bay for several years, and he never complained, or let it stop him – but it was always a matter of time, and his luck ran out last week. He is survived by his wife Kelly, and two sons: Ryan and Galen.
Rest in peace Kevin – I’m proud to have known you.
USS Salt Lake City: 1941
Here’s a first look at the navigation and temperature data from 1941 you’ve transcribed from the logbooks of the USS Salt Lake City (CA-25), a heavy cruiser commissioned in 1929. The Salt Lake City was 585 feet long and capable of making 33 knots on four steam turbines (107,000 horsepower).
The processing code used to convert Zooniverse classifications into transcription-verified and quality-controlled data was written by science team member Praveen Teleti. There are 8,760 hourly marine weather records (WRs) in this series, the first installment on roughly 832,000 WRs (~580,000 are ready for processing as of August 2021) transcribed from only our 19 ships. This is more than the total number of U.S. Navy WRs from the WWII era currently available in the global standard dataset – ICOADS (the International Comprehensive Ocean Atmosphere Data Set).
The track of the Salt Lake City for 1941 is shown in Figure 1. The first two months of the year were taken up by an extended overhaul in the Mare Island Naval Shipyard. In March the ship moved to Pearl Harbor and spent considerable time in training exercises in the area of the Hawaiian Islands. One cruise was made to Midway Island on March 17. In July and August Salt Lake City and USS Northampton (CA-26) made a voyage to Brisbane, Australia, for training and likely intelligence gathering around New Guinea. In early December Salt Lake City was part of Task Force 8 with the aircraft carrier Enterprise (CV-6), two other cruisers and nine destroyers assigned to deliver a squadron of fighter planes to Wake Island. On the way back on December 5-6 the task force was delayed by stiff easterly winds and rough seas and so was still at sea on December 71.
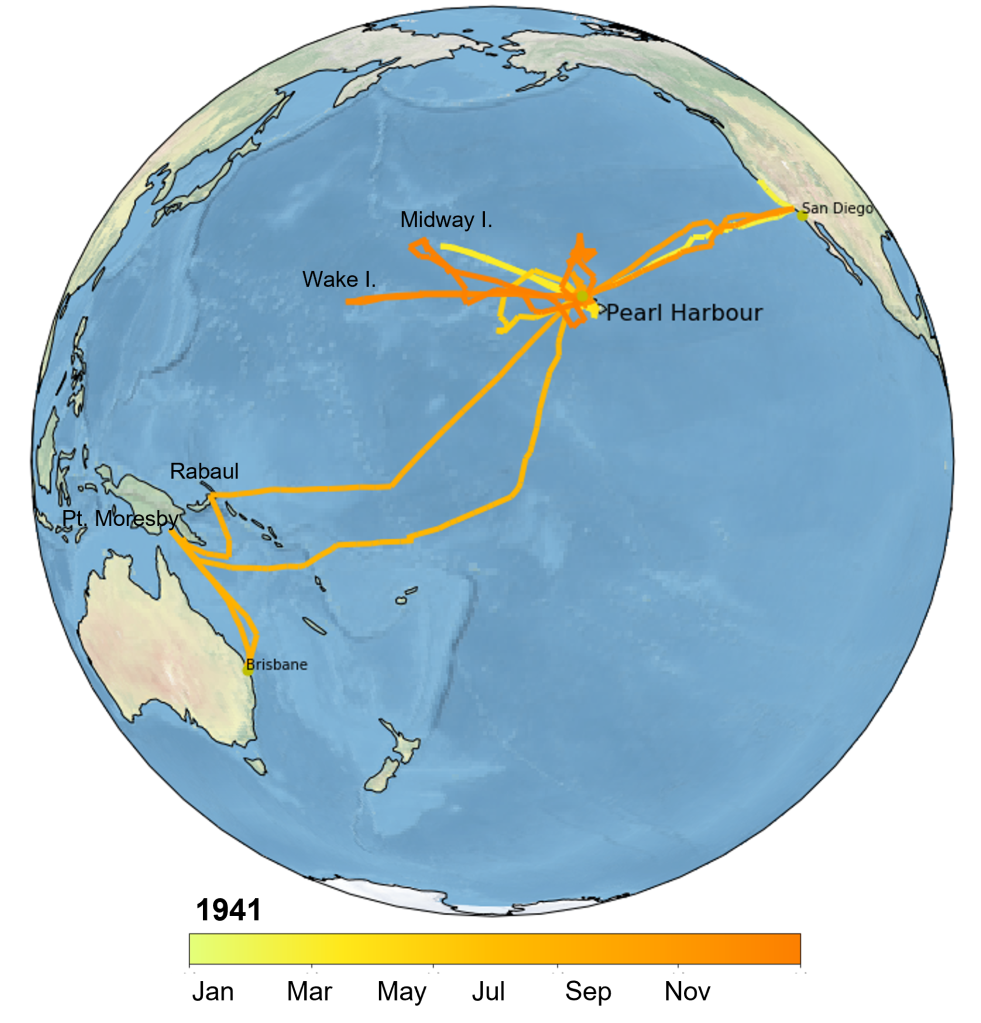
Figure 2 shows the plots of the air (blue) and seawater (orange) temperatures from the ship’s deck log, before and after initial quality control checks. The periods the ship was in port are indicated by the grey broken line. These data are nearly all from the neutrality period prior to the U.S. entry into World War II, in December 1941. Nevertheless, the logbooks show that the Salt Lake City was frequently operating in ways consistent with a wartime footing, including ‘darkened ship’ that may affect how some weather readings were made.
The most obvious difference between the uncorrected data (top) and quality-controlled data (bottom) is the frequency of large departures in the former. These seem to be associated most often with various typewriter key miss-strikes, especially the key next door (like 1 or 3 instead of 2). These have been corrected, but other characteristics of the data will need further examination, particularly relating to the seawater temperatures measured in the main engine room cooling water injection.
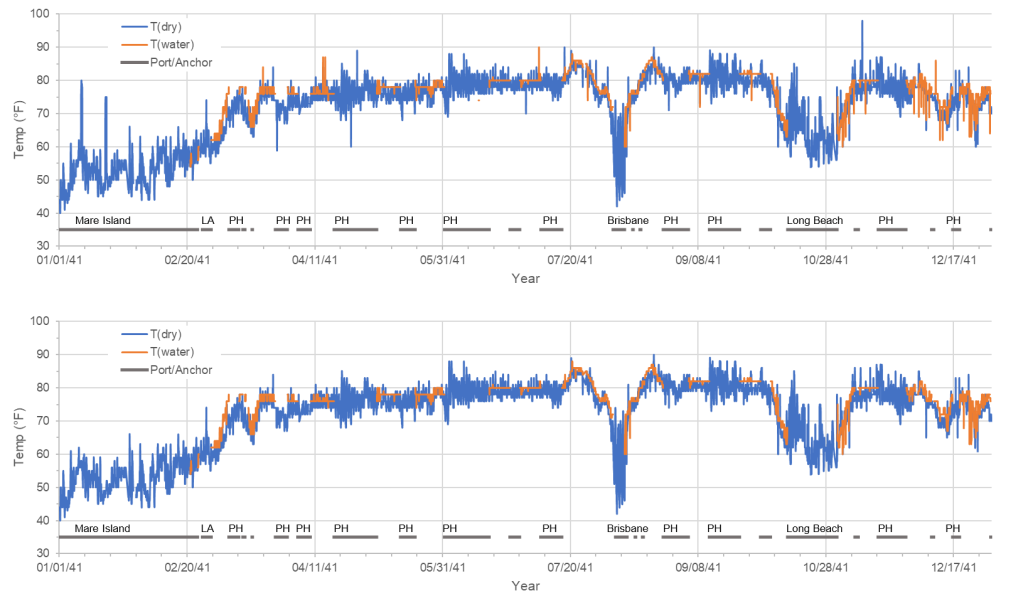
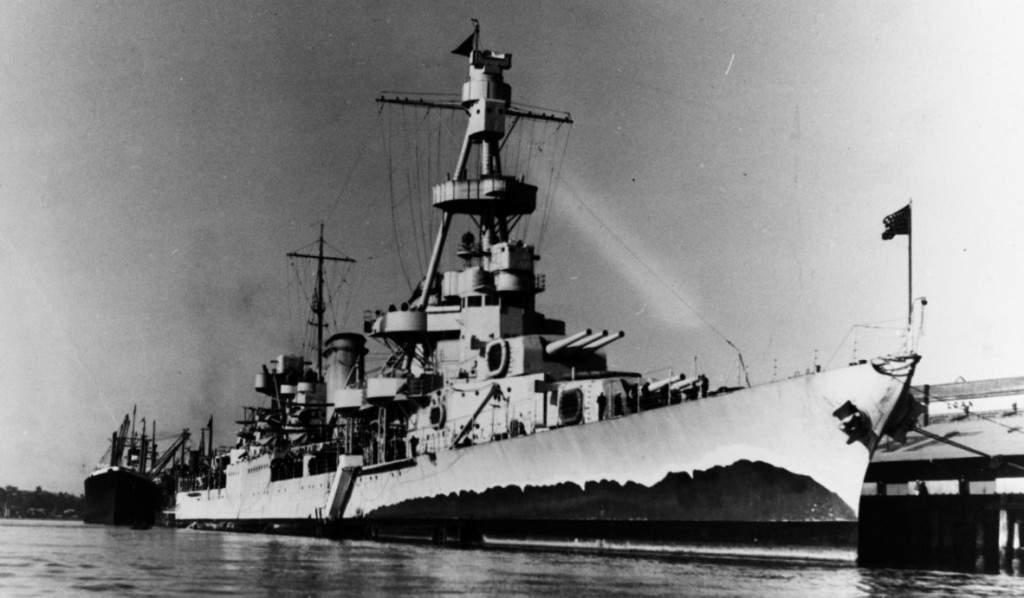
Also notable, but not surprising, is the difference between ‘at sea’ and ‘in port’ air temperatures. The higher values in port are likely the result of low air circulation in the thermoscreen, combined with a multitude of heating factors on the ship itself, and heat island effects within urbanized ports. The low values, seen for example during the September period in Pearl Harbor, are more puzzling. The period the ship was in Brisbane is marked by an especially wide daily temperature range (between ~45° and 69°), but this is well within cool season climatology for this location. A photo of the Salt Lake City alongside in New Farm, Brisbane, during this visit is shown in Figure 3.
There is a curious historical event along the ship’s track on the return voyage from Brisbane. After sailing the ship made two brief stops, possibly clandestine, to reconnoiter Port Moresby and Rabaul, in New Guinea. At the latter, Salt Lake City came to anchor on 16 August, somewhere near the port (the place names and bearing marks were left intentionally blank in the typed logbook). Three Seagull scout planes were launched, missions undeclared in the log. These places would become incredibly important to the defense of Australia and other Allies with the outbreak of war just three months later. A new analysis of pre-war planning by the Navy suggests some officers were well attuned to the dangerous situation in the Pacific that summer but were unheeded by policy makers2.
- Historical information from Naval History and Heritage Command (NHHC), Dictionary of American Naval Fighting Ships, available online at https://www.history.navy.mil/research/histories/ship-histories/danfs.html
- NHHC (2021): Richmond Kelly Turner, Planning the Pacific War. U.S. Navy Operations in World War II. OPNAV Support Section, Histories Branch. Retrieved 16 August 2021.
War Diary
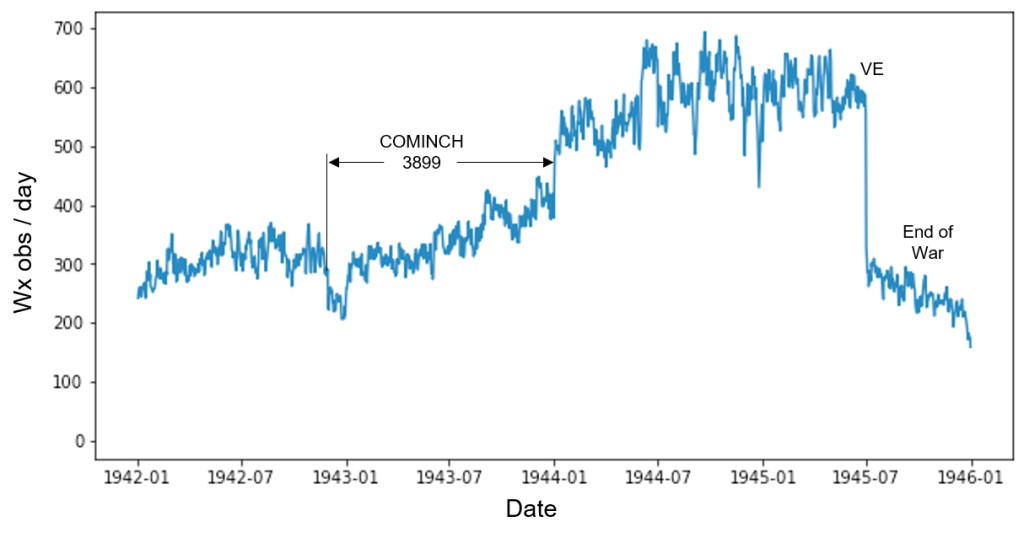
On October 19, 1942 the Commander in Chief of the Navy issued new guidance to the fleet regarding the ship’s logbook. His order, COMINCH 3899, directed that the logbook be divided into three sections: Part I Columns (the weather page); Part II Administrative Remarks (routine business like personnel changes), and; Part III Operational Remarks (War Diary) CONFIDENTIAL. Part III was to be kept separate from the other two sections. A typical example is shown in Fig. 1. It is notable that this document series was only formally declassified by the National Declassification Center a few years ago.
The purpose of this change was to decrease the likelihood that useful intelligence could be gleaned if the ship’s logbook fell into the wrong hands. In the first days of the war there were six U.S. Navy ships that were scuttled in shallow water and later salvaged by the Japanese Navy, and one captured outright, the USS Luzon (PR-3). During 1942 several S-class submarines were also accidentally grounded and abandoned in hostile territory. But perhaps the stunning success of the British Royal Navy capturing German naval codebooks and all-important Enigma machines in 1941 was the main inspiration. More about this in The Guardian.
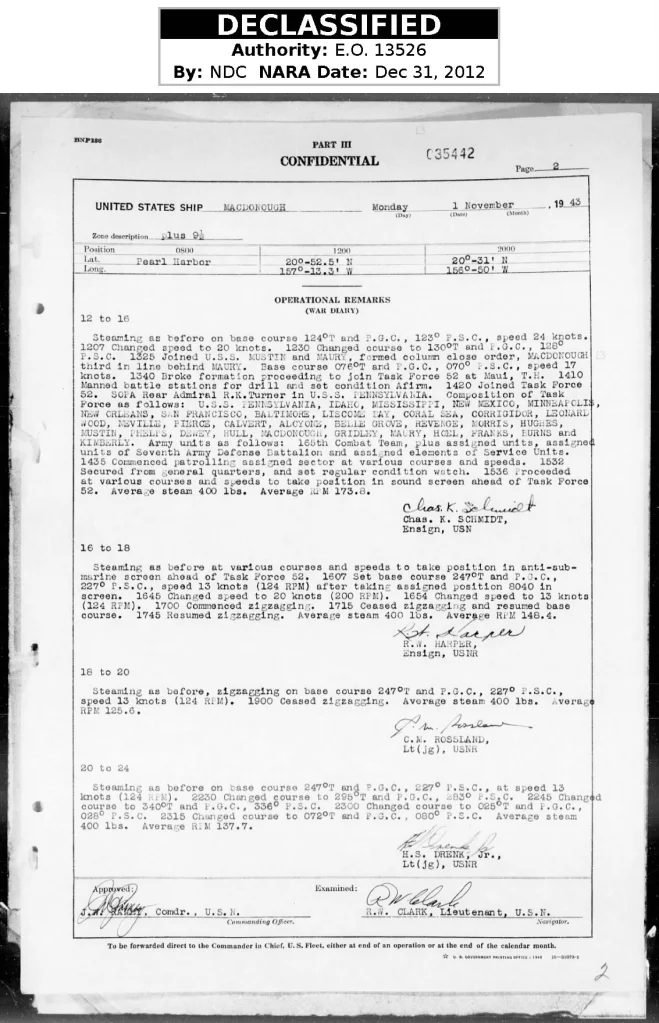
The key point for our purposes is after late 1942 the navigation data does not appear on the Part I weather page except as a single noon notation expressed only in whole degrees. The detailed navigation data was moved to the War Diary. The 3899 directive was in force until the spring of 1944, when the logbook format returned to something close to the historical pattern, insofar as the navigation data was moved back to the weather page.
Due to the time lag in getting new format log sheets out to the fleet in 1942, and again in the spring of 1944, there is considerable variance in when a particular ship’s logbook reflects these changes. Moreover, when COMINCH 3899 was issued, there were no pre-printed sheets for the new scheme available at all, so for several months the War Diary was typed out on a blank sheet that roughly followed the new instructions.
All this means that the workflow we’ll use to capture the navigation data during this period will need to be quite flexible. However, a benefit for those interested in the ship’s stories is that the War Diaries will soon be part of a new Navigation workflow. As you will see, these first-hand accounts can be extraordinarily compelling, even when written in the normally dispassionate language of the ship’s logbook.
Finally, the separation of the navigation data from the weather pages of the logbook may have affected the amount of U.S. Navy weather data originally key-punched by the Weather Bureau in the early 1950s, and later migrated into the present International Comprehensive Ocean-Atmosphere Data Set (ICOADS). Since only weather observations associated with a ship’s position were punched, loss of collation with the navigation data may well be a factor. Departures in the number of observations per day captured in ICOADS during and after the period COMINCH 3899 was in force (Figure 2) is suggestive of such a loss. This further supports the need for the data (and metadata) recovery we are working on together.
A winter reflection
An old shipmate of mine shares this poem every December, and it always makes me pause to reflect on my former career at sea, and those friends I’ve sailed with now scattered far and wide. And us Old Weather shipmates have also seen plenty of stories like this along the 45 million or so miles of ship tracks we’ve covered over the past ten years. Some, like that of the USS Jeannette, a worse tale. My own encounter with the hard edge of the ocean was on the distant rocky shore of a small island in the Beagle Channel, the strait in Tierra del Fuego named, appropriately, after the HMS Beagle. We were holed from stem to stern, but thanks to the ship’s engineers, lots of pumps, and an ice-strengthened hull of inch-and-a-half thick steel, it came out okay in the end. So as this horrible pandemic year draws to close, I say, shipmates, let us hold with hope – we will clear this weary headland and find the open sea again.
Christmas at Sea, by Robert Louis Stevenson, first published on December 22, 1888
The sheets were frozen hard, and they cut the naked hand;
The decks were like a slide, where a seamen scarce could stand;
The wind was a nor’wester, blowing squally off the sea;
And cliffs and spouting breakers were the only things a-lee.
They heard the surf a-roaring before the break of day;
But ’twas only with the peep of light we saw how ill we lay.
We tumbled every hand on deck instanter, with a shout,
And we gave her the maintops’l, and stood by to go about.
All day we tacked and tacked between the South Head and the North;
All day we hauled the frozen sheets, and got no further forth;
All day as cold as charity, in bitter pain and dread,
For very life and nature we tacked from head to head.
We gave the South a wider berth, for there the tide-race roared;
But every tack we made we brought the North Head close aboard:
So’s we saw the cliffs and houses, and the breakers running high,
And the coastguard in his garden, with his glass against his eye.
The frost was on the village roofs as white as ocean foam;
The good red fires were burning bright in every ‘long-shore home;
The windows sparkled clear, and the chimneys volleyed out;
And I vow we sniffed the victuals as the vessel went about.
The bells upon the church were rung with a mighty jovial cheer;
For it’s just that I should tell you how (of all days in the year)
This day of our adversity was blessed Christmas morn,
And the house above the coastguard’s was the house where I was born.
O well I saw the pleasant room, the pleasant faces there,
My mother’s silver spectacles, my father’s silver hair;
And well I saw the firelight, like a flight of homely elves,
Go dancing round the china-plates that stand upon the shelves.
And well I knew the talk they had, the talk that was of me,
Of the shadow on the household and the son that went to sea;
And O the wicked fool I seemed, in every kind of way,
To be here and hauling frozen ropes on blessed Christmas Day.
They lit the high sea-light, and the dark began to fall.
“All hands to loose topgallant sails,” I heard the captain call.
“By the Lord, she’ll never stand it,” our first mate Jackson, cried.
…”It’s the one way or the other, Mr. Jackson,” he replied.
She staggered to her bearings, but the sails were new and good,
And the ship smelt up to windward just as though she understood.
As the winter’s day was ending, in the entry of the night,
We cleared the weary headland, and passed below the light.
And they heaved a mighty breath, every soul on board but me,
As they saw her nose again pointing handsome out to sea;
But all that I could think of, in the darkness and the cold,
Was just that I was leaving home and my folks were growing old.
A new Old Weather project
Old Weather – WW2 is now an active Zooniverse project. The purpose of this project is to recover hidden marine weather data recorded in U.S. Navy ships’ logbooks during World War II. Like all Old Weather projects, these data will be used to drive sophisticated computer models that help us understand and reconstruct weather and climate in extraordinary detail. But there is another goal that is just as vital – to uncover the source of a mysterious distortion in sea-surface temperature data collected during the war.
This distortion, which Chan & Huybers refer to as the World War II Warm Anomaly, may not be physical in nature, but, they argue, arises from earlier bias adjustments applied to correct for differences in sampling methods. The age-old technique of hauling up a bucket of seawater then taking its temperature on deck produces a different value compared to those collected from an engine-room cooling water intake, for example. There may even be differences in values because of the characteristics of particular ships, especially how deep they sit in the water (their draft). So knowing the fleet composition within the data set, and the specifics of how the measurements were made is crucial to teasing out an answer.
Because of the work we’ve been doing with the U.S. National Archives over the past eight years or so we are in a unique position to help investigate this question – we have digital images of many of the original U.S. Navy logbooks. The logs we are transcribing in this project were selected because the ships were often in the same place at the same time, even moored alongside each other in nests. All but two survived the entire war, 1941-1945. Twelve were based at Pearl Harbor in 1941, eighteen were in the Aleutian Islands in 1942-1943, and ten were caught in Typhoon Cobra in December 1944. This opens up many opportunities to investigate sources of bias, from factors associated with different ship types, the weather instruments in use at different times, or changes in methods required by wartime operations (such as blackout for example). It will also be possible to investigate how tropical and sub-polar environments may have influenced the data in different ways.
Moreover, with logbooks in hand, we can also better understand legacy issues associated with U.S. Navy data key-punched onto IBM cards in the early 1950s and subsequently migrated into today’s widely used International Comprehensive Ocean Atmosphere Data Set (ICOADS). Already we have found out that the fleet composition represented in ICOADS is tilted toward submarines, destroyers, and destroyer escorts. Aircraft carriers, with probably the best-equipped and best-trained weather personnel in the Navy, appear to be mostly neglected.
The World War II Warm Anomaly is large enough to appear in the long-term global mean sea-surface temperature record. This presents as an aspect of natural variability that may not in fact be real. If this turns out to be true, the corrected temperature record would appear to evolve upward more smoothly over time, and correspond more closely to model results as described by Chan & Huybers.
Getting oldWeather data ship-shape for science
Author of Post: Larry Spencer
Date of Post: Tuesday, December 04, 2018
The oldWeather science team is using the ship logbook observations to help make a three-dimensional global reconstruction of the Earth’s weather in order to understand the past climate of the Earth and better predict its future. This uses the ship observations in exciting and fascinating ways, but it needs them to be processed into a precise format and as accurately as possible. We know that the ship logbook transcriptions made by our volunteers are very accurate, but we still have plenty of challenges in using the data. Some of the entries were incorrect when originally recorded in the logs, and we need to infer some information that is not in the logbook explicitly. Therefore, we have to calculate exact positions and standardized dates from the local dates and location names provided in the logs. We need to get the observations ready to sail!
You might be wondering how all of that transcribed historical weather data is processed and then ends up being used by the scientists after the work of the volunteers has been completed. As one member of the science team, I work on this extensively, and I can tell you that it is a very enjoyable process. For each one of the oldWeather ships available, I meticulously analyze and quality-control the transcribed data for both latitude and longitude positions and weather observations (checking for and removing existing errors in the data) in order to ensure the highest-quality datasets possible. As a way to illustrate just how important this process is, two maps are displayed below. The first one is a “Before Map” that shows the Thetis’s positions and tracks (represented by the gold dots and lines) that were automatically generated by Philip’s software from the place names transcribed from the logbooks. The second one is an “After Map” that shows the ship’s positions and tracks after I carefully analyzed and quality-controlled the geographical positions data from the ship. There is a significant difference between the two maps displayed, with the “After Map” illustrating a much more “polished-up” and realistic version of the ship’s voyage positions and tracks (for instance, the ship not traveling over any land masses).
Figure #1. – “Before Map” of the oldWeather Thetis ship’s voyage positions/tracks throughout the time period of May 01, 1884 – December 31, 1908 before quality-control on the geographical positions data from the ship.
Figure #2. – “After Map” of the oldWeather Thetis ship’s voyage positions/tracks throughout the time period of May 01, 1884 – December 31, 1908 after quality-control on the geographical positions data from the ship.
The transcribed data produced by oldWeather are all stored in one big database. From this database, Philip’s software makes two separate data files for each ship: one for the latitude and longitude positions and one for the weather observations. I then apply a meticulous data analysis/quality-control process to the data that is contained in both of these files for each ship. As a part of this process, to make error-detecting a bit easier, I import the weather data into a spreadsheet and arrange it in order from the least to the greatest values and from the greatest to the least values. This is a quick and easy method of detecting and correcting the most obvious errors that exist in the data. I complete this for the three meteorological variables of surface pressure, 2-meter air temperature, and sea surface temperature. In addition to this, I manually edit the data where errors exist throughout the entire files, both in the geographical positions data file and in the weather observations data file. I use a standard set of criteria as a guide for how to locate errors and perform quality-control on the data where I detect problems. For example, in regards to the surface pressure data, if there are any values provided in the original file that are lower than 28.00 inches of Mercury or if there are any values that are higher than 32.00 inches of Mercury, then I remove that particular value and replace it in the file with an “NA”, which represents “Not Available”, because it would be classified as a “meteorologically-unrealistic” value. This specific criteria is used in applicability to either if there are any values of this type contained in the original file or if there are any of these types of values recorded in the original ship logbook. Another example would be if there are any values that have been transcribed correctly by the volunteers, but are obviously incorrectly recorded in the original ship logbooks, I then either remove and replace the values given in the original file with an “NA”, or I remove and change them to the obviously-correct values, depending upon the exact circumstances. In those particular circumstances, I make a careful comparison of the “obviously-incorrect” values with the values provided directly above and below them in the original ship logbooks and then proceed to manually edit them accordingly. When I have performed and completed this technical process in its entirety, I then convert a given ship’s quality-controlled weather and position data from the transcribed database into a standard format called the International Marine Meteorological Archive (IMMA) format. Each oldWeather ship has a final file that is created for it, which contains the combined weather and position data presented in the IMMA format. The overarching goal of this entire process is to produce standardized data, as accurate as possible, that can be easily used by professional scientists in major research projects.
This IMMA-formatted data is being used in several ways, notably for assimilation into the Twentieth Century Reanalysis Project (20CR) and for distribution through international databases, such as the International Comprehensive Ocean-Atmosphere Data Set (ICOADS) and the International Surface Pressure Databank (ISPD). For example, this IMMA-formatted data for OldWeather3 ships will be archived as an ICOADS auxiliary dataset in the Research Data Archive (RDA) at the National Center for Atmospheric Research (NCAR) located in Boulder, Colorado. The overarching purpose of doing this work is to develop weather and climate models and to better predict and understand extreme, high-impact weather and climate phenomena on a global scale. We would be much less able to successfully accomplish this purpose without our oldWeather volunteers! So, I want to extend a huge “thank-you” to all of our volunteers for contributing so much time, effort, and dedication to this project ….. because it all starts with the very critical step of getting the observations and positions contained in the original ship logbooks accurately transcribed!
A better centenary
Exactly 100 years ago: at 11 a.m. Paris time on 11 November 1918, the Armistice of Compiègne came into force, and the Great War came to an end. Though there had been no major naval battles since Jutland, the Royal Navy played a vital role in hastening the end of the war by defeating the German submarine campaign and maintaining an economic blockade. A key moment leading to the armistice was the Kiel mutiny – when sailors of the German High Seas fleet refused to sortie for another battle with the Royal Navy.
We get to read our own particular view of the armistice, and the surrender and internment of the German Navy that followed, in the words of our own logbooks. The logbook editing team has been working extra hard over the last few months to make sure that there is an edited version of every one of the oldWeather logbooks from the WW1 period available on naval-history.net. You can read the characteristically terse accounts of the end of the war from a whole list of ships from HMS Almazora (‘1.5am: Signal re “Armistice” received.’) to HMS Virago (‘11.30am: Party left for thanksgiving service on board HMS Tamar’).
This November 11th we not only remember those who died in the war, we remember Gordon Smith, who did so much to lead and inspire the historical work done with our logbooks. It was Gordon’s fond wish to have the WW1 logs edited by the centenary of the armistice, so we also have something to celebrate: Congratulations to all those who have worked on transcribing and editing the logs to complete this.
The Sitka Hurricane of 1880
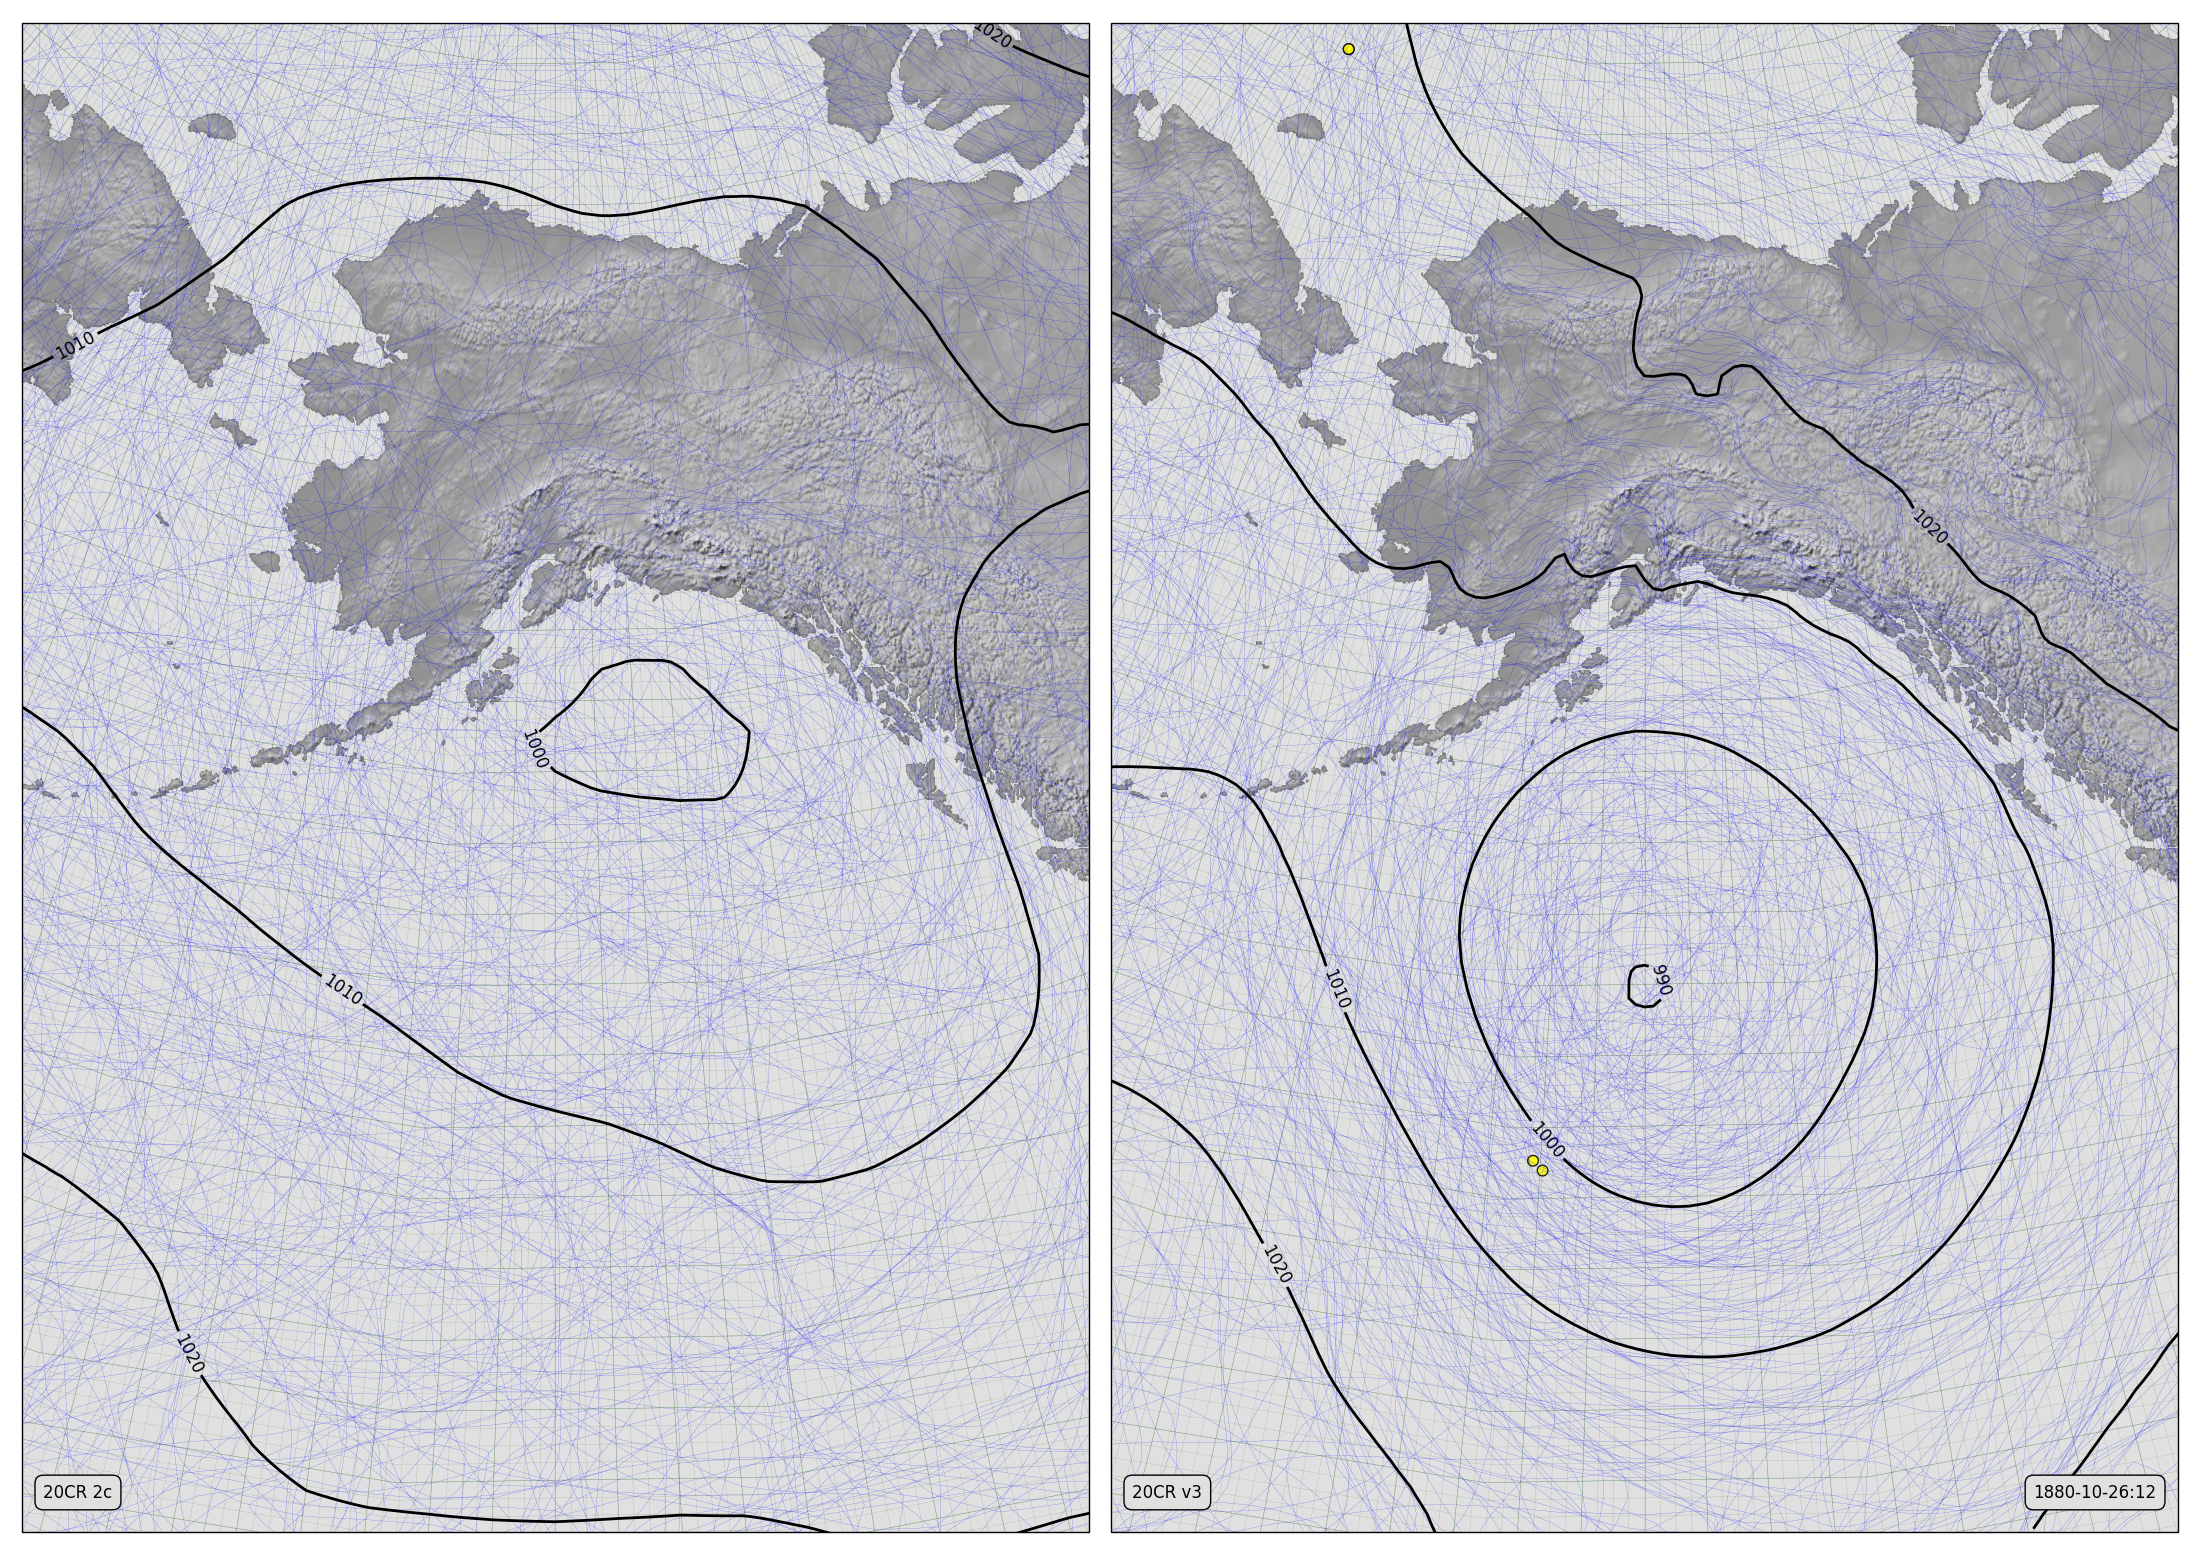 |
| Two reconstructions of the ‘Sitka Hurricane’. Pressure contours before (left) and after (right) adding oldWeather-Arctic observations from USC&GS Yukon. (Details). |
Sitka is in the Alaska panhandle, at 57 degrees North. So the storm that hit them on October 26th, 1880 can’t possibly have been an actual hurricane. But it was a very severe extratropical cyclone – probably stronger than any storm that has hit the Sitka region since.
Worst-on-record storms for any region are worth studying – they set a benchmark for predictions of future extreme weather, and they are a great target for attribution – can we find out just why they were so bad? Some of our colleagues, led from the University of Bern, looked at this storm in the Twentieth Century Reanalysis. Almost immediately, they hit a snag:
Because the next assimilated pressure measurements are located more than 1000 km south of Sitka, the storm cannot be found in the 20CR2c ensemble mean
That is, because there are no pressure observations from the north-east Pacific in our databases for late 1880, the reanalysis uncertainty is so large we can’t say anything much about it.
But that was pre-oldWeather Arctic – since then we’ve put many new observations from oldweather into a major database update, and the Twentieth Century Reanalysis (20CR) team have been working night and day building a new version of their reanalysis. The resulting improvement is large – the image above shows a before-and-after reconstruction: The key is those black concentric circles – a characteristic marker of a storm in a weather map, and of course the yellow dots – those mark our new observations. The hero here is USC&GS Yukon, providing those vital observations in the north Pacific. (You can just about see the the Jeannette up there in the Arctic Ocean also, but she’s too far away to have much effect on this storm).
But Wait, There’s More!
When we sent out our last batch of new observations to the climate datasets we had not completed USS Jamestown, but now we have, and the Jamestown was moored in the harbour at Sitka at the time of the storm. So we shipped those data over to the 20CR team, and they quality controlled them and managed to add them to their system just in time to include them in the final reconstruction for their new reanalysis. So we have another new reconstruction, with our Jamestown observations in too:
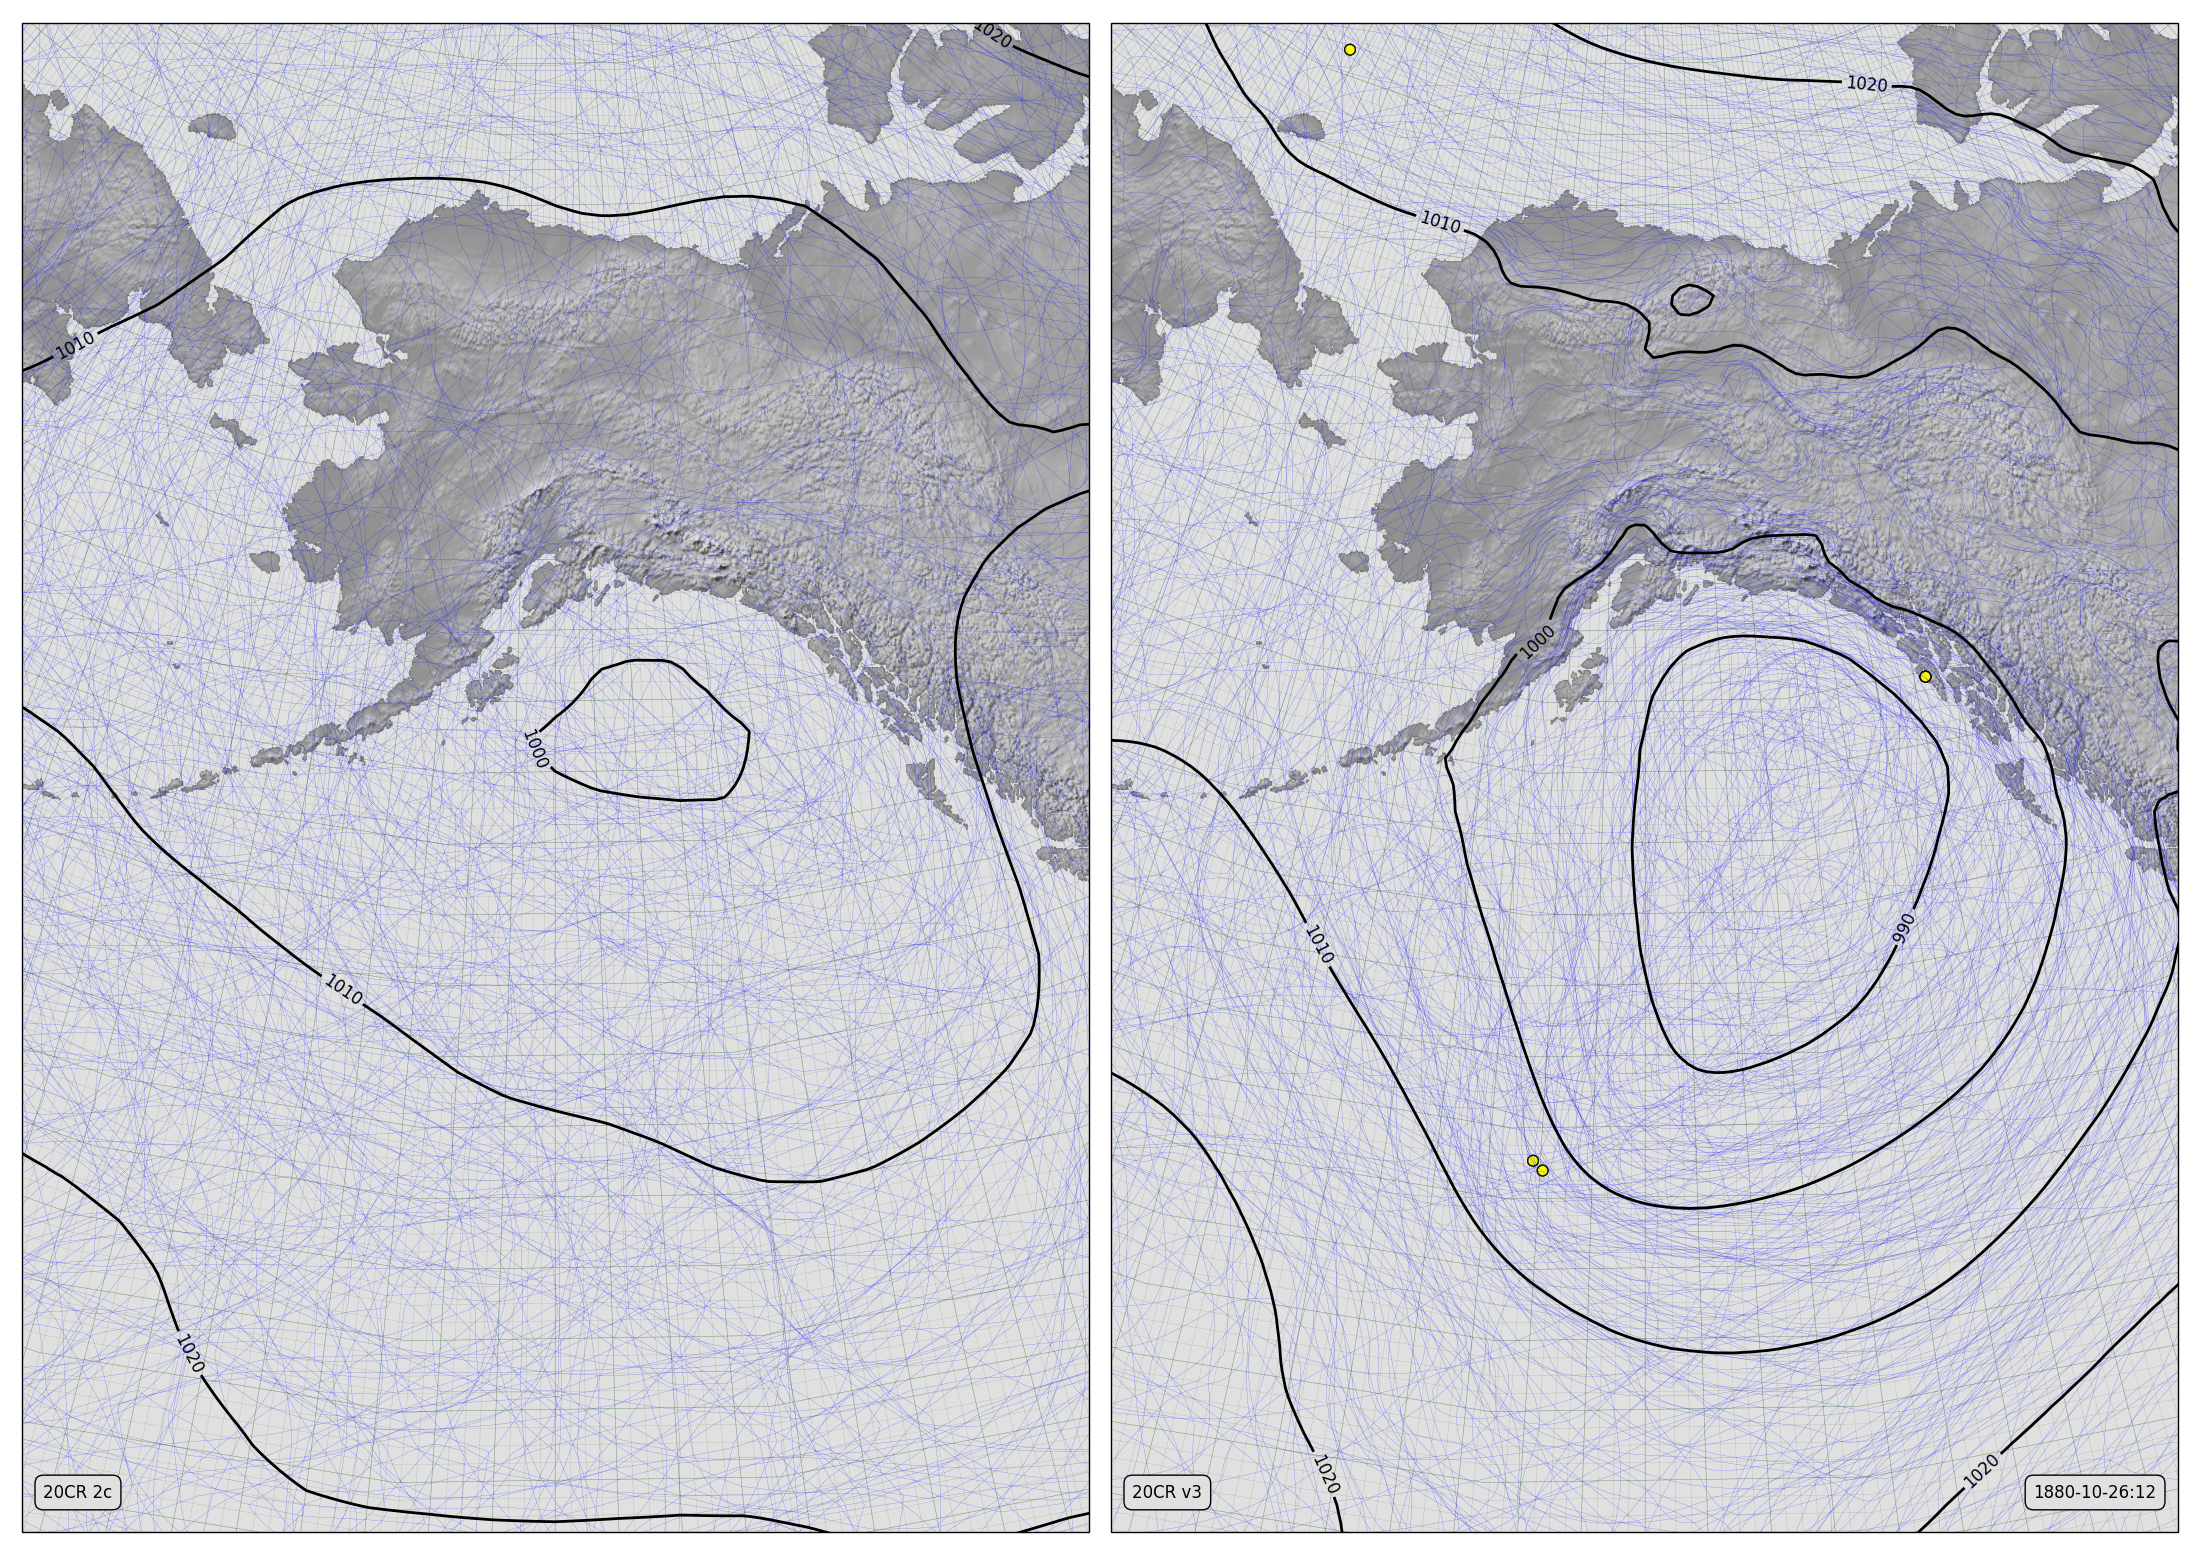 |
| Two reconstructions of the ‘Sitka Hurricane’. Pressure contours from 20CR2c (left) and 20CRv3 (right) adding oldWeather-Arctic observations from USC&GS Yukon and USS Jamestown. (Details). |
Adding the Jamestown strengthens and improves the storm reconstruction still further (particularly apparent in the video diagnostic).
So thanks to everyone who has worked on the Yukon, the Jamestown, and 20CRv3 – between us, we’ve created a hurricane: An iconic storm which was missing in the last reconstruction is present in the new one. The uncertainty in the reconstruction is still large, but future researchers now have something concrete to work on.
Editing the weather observations
Original oW1 observations (red dots) and as revised using the edited ship histories (smaller yellow dots). Some new observations have been added (ships for which we now have good positions), a few errors in the original observation set have been removed, and much valuable new detail has been added.
We finished transcribing the original RN WW1 oldWeather logbooks some time ago. And as soon as we could, we produced a set of climate data from those transcriptions: 1.6 million new weather observations. Those data have now been included in standard climate databases, and produced a notable improvement in major research products.
However, we said at the time that those were preliminary data. They were useful as they were, but we hoped to improve them further in the future. In particular we struggled to get good position information from every logbook page: Generally, when they reported their latitude and longitude (’32 27 03 N’, ’24 78 08 W’) we could locate them successfully (though there are difficulties), but often the logs give their location as the name of a port or place, and tracking that down can be hard.
When we made the preliminary set of climate data we did all the data processing (to turn the log transcriptions into climate records) in software. This is fast, but not powerful enough to deal correctly with the difficult positions. It got us what we most needed (as much data as possible, now) but a substantial fraction of our 1.6 million observations were left with positions that were missing, approximate, and, occasionally, just wrong. These issues did not damage climate products using the observations, but they did restrict them. Effectively, many of our observations were not good enough to use. What we really needed was a careful, expert examination of the record for each ship, teasing out the precise route of each ship from the limited, idiosyncratic, and occasionally just wrong, information in the log. This would require two things, a group of expert analysts, and time for them to work.
One of the glories of oldWeather is the expertise and dedication of the project community, and the ship history editors, in particular, have been working through the log transcriptions, using their expertise to make edited histories, and maps, of their travels. They have not had enough quite time to finish the task – not every ship has yet been edited – but most are done, and once again we need the data now. So I have gone through the edited histories and used their position records to improve the weather data records.
This has improved our weather records a lot (see the video above). Some ships with log details that defeated the software the first time around now have good positions and can be used for the first time. More have details improved and some errors fixed. A particularly noticeable improvement are the gunboats on rivers in China, which now show movement along the Yangtze in good detail. We still have 1.6 million records, but about 500,000 of them have received a big upgrade in their quality, and this will feed through to substantial improvements in the climate products we derive from them.
Gordon Smith
Gordon Smith, who guided the historical side of oldWeather from the beginning, died on 16 December 2016 after a long illness: he was 75.
Gordon joined oldWeather in April 2010. He was brave enough to team up with a group of scientists planning a citizen science project rescuing historical climate observations. His job was to broaden the scope of the project – to teach us to value and use the ship logbooks we were reading as historical records, not just sources of pressure and temperature observations.
Gordon was a serious scholar, the author of two books on naval history, but he also had the vision to see that writing books was no longer the best way to communicate his subject, and the courage to try something new. He founded a website (naval-history.net) and, with a group of collaborators, built it into a valuable resource for both professional and amateur historians.
The thousands of volunteers contributing to oldWeather offered a flood of new material for naval-history.net, but that material needed to be checked, collated, and edited, to be useful to researchers. Gordon dealt with this by engaging unreservedly with the volunteers reading the logbooks; advising, encouraging, and teaching anyone interested. Some of the volunteers became sufficiently expert and enthusiastic to take on the necessary editing work, and this group of new naval historians is now playing a major role in the ongoing development of naval-history.net.
The success of oldWeather as a history project has also helped our work in climate science. Expanding the project in this way has been vital in sustaining the public interest that has kept oldWeather going for six years; now 20,000 people have contributed, generating millions of additional historic weather observations for use by researchers.
Gordon was able to do all this because he was not trying to write a book, or build his personal career as a historian. Instead he was willing to build naval-history.net as a public service, and to train and support a large number of amateur historians working with him. This long period of innovative and unselfish work has not only produced a valuable historical resource, but has also been of material assistance to climate science. oldWeather is both bigger and better for his contributions, and we’ll go on building on what he started.


